building management UI projects
stanford datacenter heating and energy ui
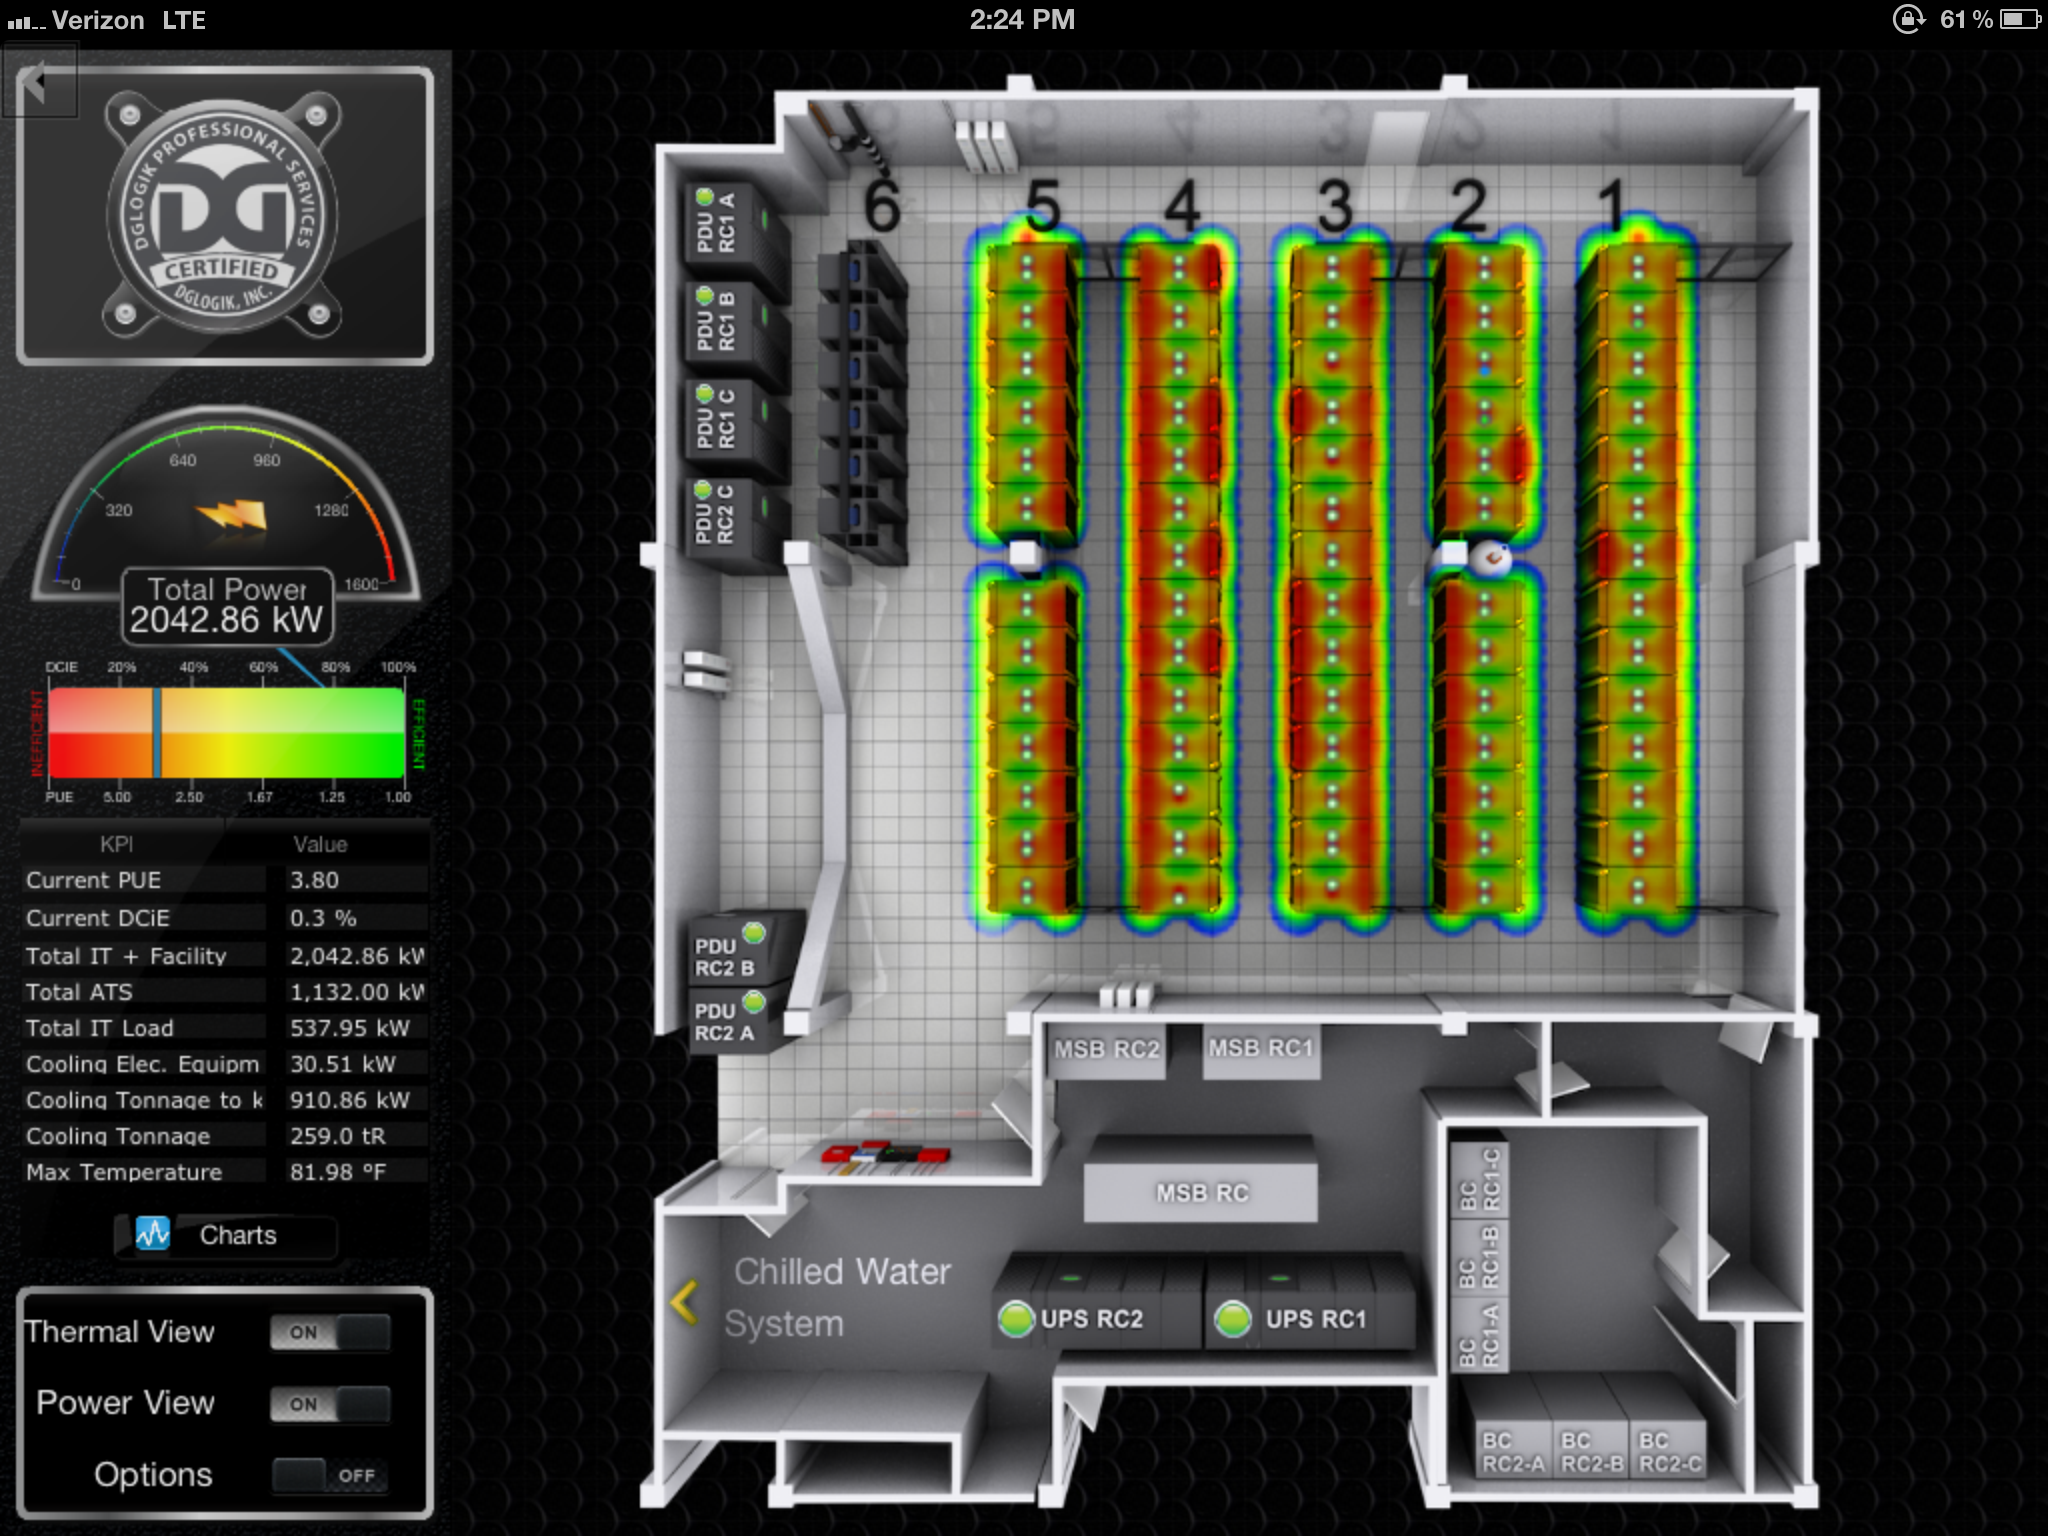
Stanford’s datacenter needed a visual interface to track how well their cooling systems were performing in an easy and intuitive UI. Our team was brought in to design and develop a tablet app that would allow the managers at the datacenter to see where the cooling system was efficient and where it was failing. The were able to present the data to the facility engineers to improve the cooling infrastructure where it was needed.


101 california, San Francisco - Kiosk UI
My team was tasked with creating the 101 California building’s digital interface. We started with an intricate 3d model rendering of the building and applied it to a simple energy interface. The facility manager is able to track the power demand, consumption, and even track back to previous days where the energy usage was high or low.


